What are the emissions for traveling from Ireland to Spain by diesel or electric vehicle?
Glyn Hudson has been inspiring me since I came across his account on Twitter and Youtube about his experiences with a Nissan e-NV200 electric camper. For his recent trip to Chulilla from the UK, he did the calculations for this the CO2 emissions driving, including ferry, etc. It got me thinking about the best method we could have used for travelling from home in Dublin, Ireland to Cornudella du Monstant, Spain for the trip we took over November and December.
From Ireland, there are other options for travelling and so, before I give the answer to what was the most environmentally friendly (from a carbon dioxide emissions perspective) if you were given the choice of options below, how would you rank them in order of best to worse in emissions?
the ferry direct to Spain
the ferry to France and driving the rest of the way
the ferry to the UK, driving across the UK, the ferry to France and driving the rest
flying to Reus and driving to Cornudella
(As an initial declaration, for the final two-month leg of our six-month retreat, we took the ferry from Ireland to Spain, and vice versa on the return journey).

Calculations
To work it out, I took Glyn’s notes (right) and tweaked them slightly. Glyn’s notes described a diesel van with either 30mpg or 63mpg. I’ve been logging all details for our VW Transporter (a 2005 T5 model: 1.9tdi 105) and it’s worked out at 45mpg: way better than I expected to be honest! However, it’s obvious why it’s so good: almost all of the driving has been on motorways at a steady 100-110km/hr. In Dublin city, when we do have to occasionally use the van, I’d optimistically give it 30mpg in stop-start traffic and that’s been generous! So, with that, I split his co2 emissions down the middle to give a 45mpg output of 186g Co2 per km.
After that, it was a case of working out the different parts of travel. For example, with the ferry direct to Spain (the method we used), it involved driving from Dublin to Rinsakiddy in Cork, then a ferry from Ringaskiddy to Santander in Spain, and then driving from Santander to Cornudella. The same approach was taken for all others.
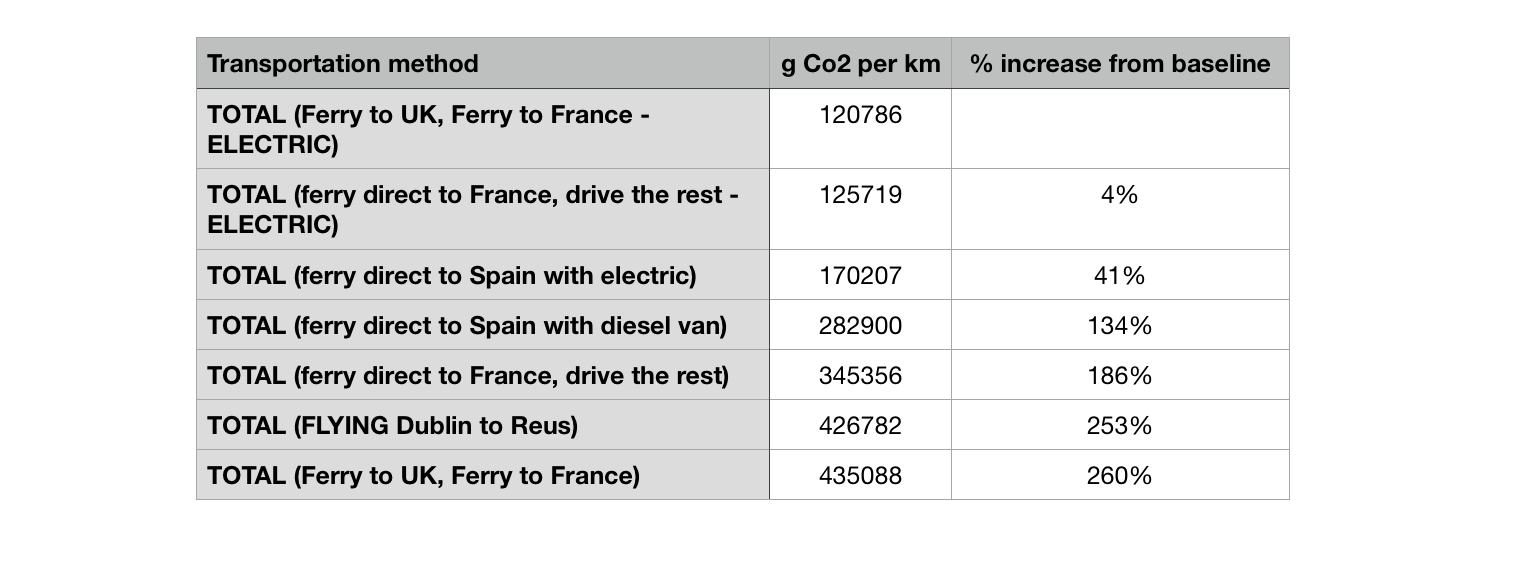
So, without further ado, here’s the list of outputs of grams of Co2 per km ranked from left to right in order of best to worst.


As you’ll see, there’s quite a significant difference between best and worse, with the worst offender producing over 54% more emissions. That is not an insignificant number! However, here’s the eye-opening part….flying was not the worst method. The honours for this is landbridge through the UK, with two ferry crossings, and two long drives (across the UK, and the length of France) and a grand total of 2540km. The flight comes in lower also because it’s more direct and is around 1800km (including the final short drive to Cornudella) and while the emissions are worse for flying per km, the shorter distance offsets the worse emissions. For those wondering what route I took through the UK, I used the method of a ferry to Holyhead, then driving to Portsmouth, ferry to Cherbourg and driving from there to Cornudella.
(Note: the numbers I used are likely slightly inaccurate so it’s plausible the flight is worse, however, likely averages out as my mpg numbers are averages also. It’s also plausible that the flight routes slightly differently and therefore increases the distance).
Including Electric
For fun, I took Glyn’s numbers for an electric van and used them to calculate the emissions for this option also for whenever I get my hands on an electric van. Note there is a guesstimate here for one aspect: I’m not aware of the emissions output for Ireland for electric vehicle charging so in this case, I used the worst case of Spain (49g CO2/km) as I doubt we’re as good as the UK(35g CO2/km) just yet and there is absolutely no chance we’re better than that and closer to France (12g CO2/km)!
Firstly, I’m going to show the list below taking what was the most efficient method from the previous list (the ferry direct to Spain). As you’ll see below, it’s an almost 40% reduction in emissions. Interesting, and this also doesn’t account for whether you may be able to charge the van on the ferry and potentially making another small reduction. Still, it’s a big drop and shows the benefits of moving to an electric vehicle (not to mention the reduced running costs on an electric vehicle, etc.).

However, this is where it gets interesting. If I recalculate all the other driving options through France of the UK and instead use an electric vehicle in place of the diesel, you get this below. As you’ll see, this is where it gets very interesting. The option of driving through the UK becomes the best possible option, with the ferry direct to France a close second (and again, accounting for variations, is essentially the same)! This is amazing - using a diesel vehicle, this is as bad as flying. For those enquiring about how this has occurred: essentially, a ferry is about as efficient as a car capable of 63mpg so by reducing the amount of mileage on the ferry and replacing it with more time in the efficient electric vehicle, it makes a significant dent in the emissions output.
Ferry / Flight Emissions
That also highlights another piece on the transportation aspect of emissions: ferries are relatively good with emissions (at 63mpg equivalent), however, there’s likely a lot more room for improvement going forward. I’m sure we’re a long way from being able to take the ferry the whole way from Ireland to Spain by electric power alone (electric passenger ferries do exist, the world’s first only cover a 6km journey, although China has an electric boat in operation that is capable of 80km - however the distance from Ireland to Spain by boat is roughly 1,000, at least 13x increase in range).
The other dark horse is flying. At present, it’s unspectacular (however interesting how comparable it is to landbridge through the UK). There’s also movement within the aviation industry to look at options to reduce their emissions. Again due to the limitations of battery capacities, like ferries it’s unlikely there is a big step change in the next five years for long-distance flights, however, it will also be interesting to watch this space. I cannot see people completely stopping flying so anything that reduces this emissions output can only be seen as a good thing. The other aspect that doesn’t get considered also as an ‘environmental’ usually: as we brought our camper, we were able to bring a large quantity of gear/clothing with us that saved us having to purchase for the stay while there). A significant draw-back of flying is the baggage limitations where it’s likely on a longer trip, you’ll be required to purchase items that likely will be dumped at the end of the trip also.
Conclusion
So with that, thank you for reading. You’ll find the files I used below if anyone is interested in experimenting themselves. I’m feeling glad we took the ferry approach now for multiple reasons: it’s the most environmentally friendly, but it was also the most relaxing due to the reduced amount of time behind the wheel driving and being able to walk around on the ferry. I guess that highlights an interesting piece for whenever I move back to an electric vehicle and have to consider the driving option once again: hopefully it’s a Tesla with full self-driving capabilities (see below) so I can sit back and watch a movie (although you still can’t get up and move around of course….)!
Any thoughts yourself?
UPDATE 27/01/19: I’ve added some more details around the impact if there’s more than one person travelling. Details are here.


